This article was originally published as a CSIS Korea Chair Platform on October 4, 2021.
860,000 tons |
| Based on 2020 crop yields combined with the officially planned commercial imports, North Korea still has a food gap of approximately 860,000 tons—equivalent to roughly 2.3 months of food use. If the gap is not accounted for through additional commercial imports or food aid, North Koreans could suffer from acute dislocations, according to the UN Food and Agriculture Organization (FAO). |
Media www.rajawalisiber.com – Food security is a perennial domestic concern for North Korea. The total domestic consumption of agricultural products, particularly cereals, soybeans, and potatoes, structurally exceeds the domestic production volume in North Korea. As a result, the country heavily depends on commercial imports from China to fill the gap. Unfortunately, the chances of closing this food gap through increased trade and imports are low as a border shutdown to trade since January 2020 due to COVID-19, along with continued sanctions, have provided additional challenges.
Based on 2020 crop yields, the domestically available crops, combined with the officially planned commercial imports, still left a food gap of approximately 860,000 tons – equivalent to roughly 2.3 months of food use. As a result, the FAO predicted that if the gap is not accounted for through additional commercial imports or food aid, North Koreans could suffer from acute dislocations, described by the Food and Agriculture Organization of the United Nations (FAO) as an especially “harsh lean period,” between August and October of this year.
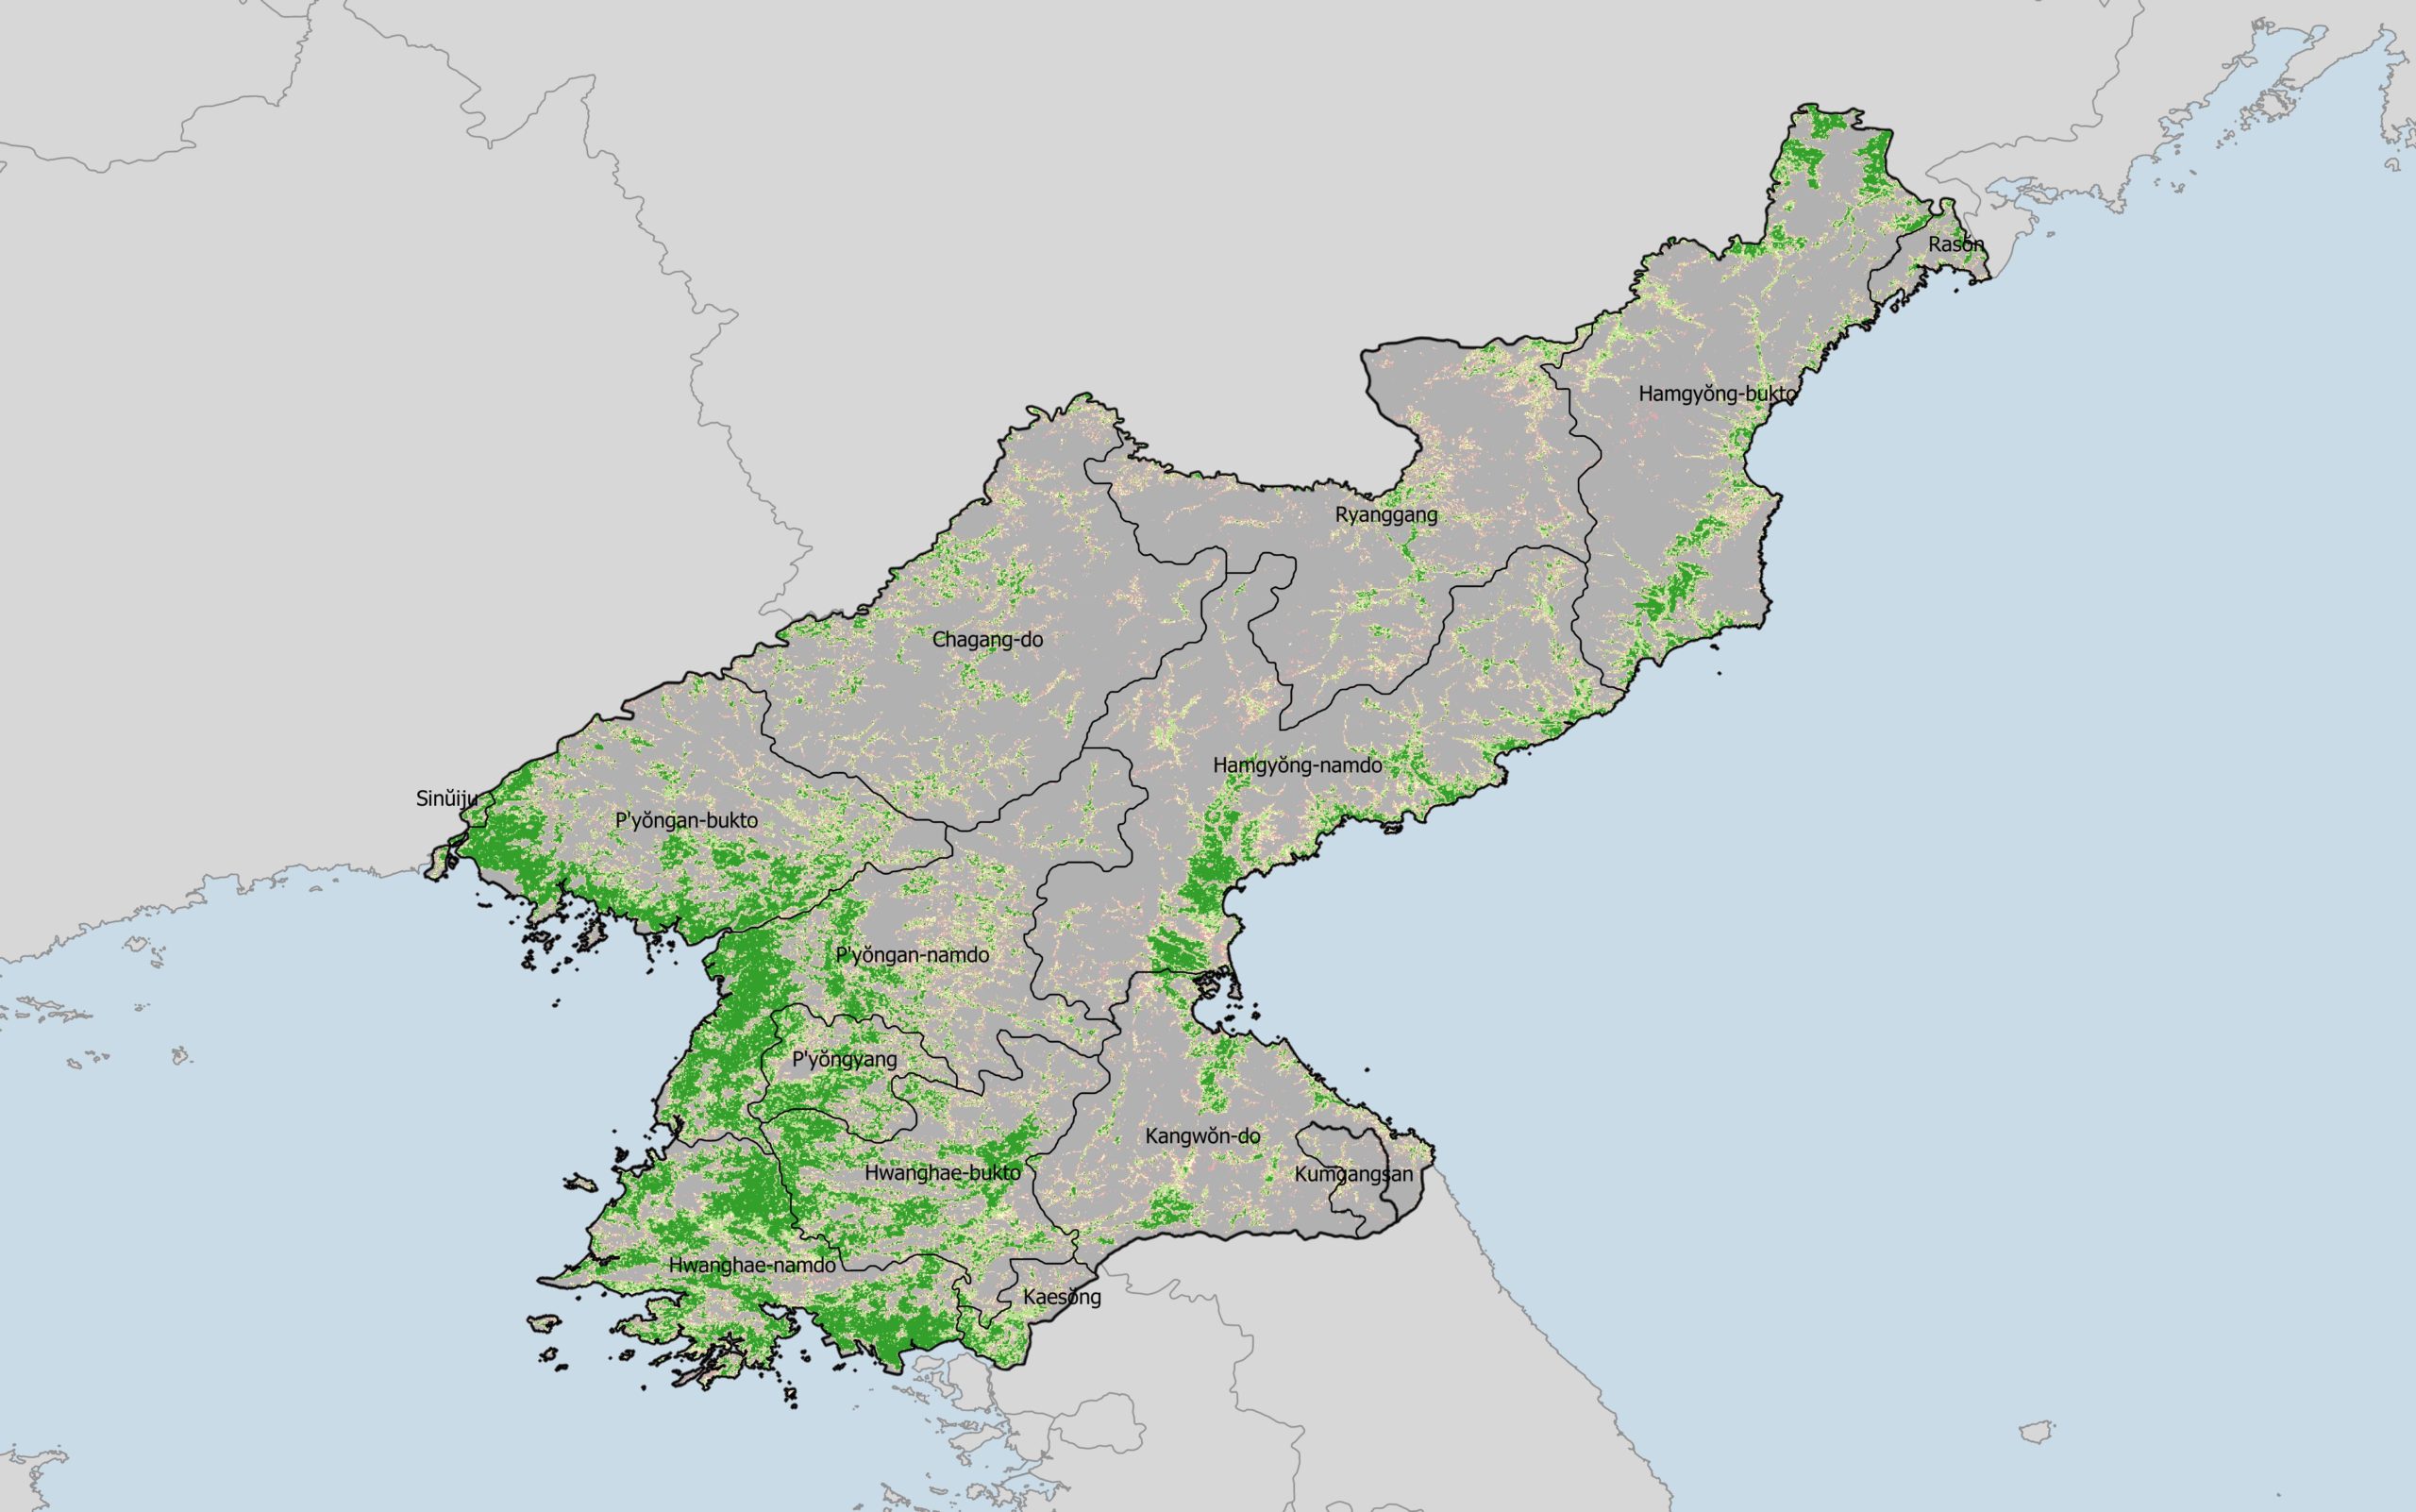
To fully understand the current condition of North Korea’s food production and crop yields that the country will depend on for the coming year, CSIS used satellite imagery to observe and monitor crop and growing conditions across the country. Standard remote sensing analysis such as normalized-difference vegetation index (NDVI) can be calculated to describe the observed crop growth vigor and indicate crop quality and health. In early July, the FAO reported a favorable start to the 2021 main season, with crops in good conditions. This report evaluates NDVI measures of these regions for four dates after the release of the FAO report, over the agriculture production period: July 4, 2021 (early July), July 20, 2021 (mid-July), August 5, 2021 (early August), and August 21, 2021 (mid-August).
Key Findings
- Although the FAO reported a favorable start to the 2021 main season in early July, crop conditions from July to August point to a yield that falls short of an average or good harvest. While not yet a crisis of famine proportions, the negative trend, combined with external factors such as low yields in the previous year and flood damage to the northeastern croplands and crop transport infrastructure, aggravate the food insecurity in the country.
- By mid-August, data indicated minimal improvements and dramatic reduction of crop conditions in some provinces. The poor crop performance, combined with the recent heavy flooding in the northeastern provinces, is also expected to further curtail this fall’s harvest volume.
- The geographic distribution of the impacted areas (e.g., mountain valleys in the north and northeast) make it challenging to address food supplies to more remote areas that are seeing impacts in 2021. Additionally, these problems may be exacerbated by flood damage to the already poor rail network along the east coast, which is the primary means of transporting food supplies around the country.
Analysis
Agriculture production areas were identified using a Copernicus Global Land Service geospatial mask to focus the analysis. The land cover layer produced by the Copernicus Global Land Service using the PROBA-V sensor data was used (Buchhorn, M.; Smets, B.; Bertels, L.; De Roo, B.; Lesiv, M.; Tsendbazar, N. – E.; Herold, M.; Fritz, S. Copernicus Global Land Service: Land Cover 100m: collection 3: epoch 2019: Globe 2020).
When NDVI is calculated, the output range for vegetation ranges from 0-1 and represents the density of green vegetation in each pixel. From this, the NDVI data were broken into four categories, with percentages reflecting the proportion of healthy crops in the observed area:

The imagery (Figures 1-4) shows the progression of crop health, transitioning from planting and emergence to canopy and maturity.
Early July


The early July to mid-July timeframe should demonstrate a significant increase in NDVI as the crops emerge and develop to canopy. The early July NDVI readings, as expected, show lower percentages of acreages with Fair or Good crop conditions.
In early July, provinces and cities where there was concern about the condition of the crop showed very low acreages of Fair or Good conditions. The most notable anomalies occurred in Hwanghae-namdo, where only 15% of cropland was Fair or better by early July. This indicates that planting was likely delayed in most of the province, probably due to weather conditions.
Other regions appear to have experienced similar patterns in planting and the early growing of crops, where only about 20% of the croplands were Fair or better. These include Kaesong, Kumgangsan, Pyongyang, Rason, and Ryanggang.
Mid-July


By mid-July, many crops should be developing significant plant and leaf structures. NDVI readings should be significantly improved from early July, and most of the acreages should have crop conditions in the Fair to Good categories. NDVI data for North Korea indicates that several regions appear to have struggling crop conditions. These include Chagang-do, Kangwon-do, Kumgangsan, Rason, and Ryanggang. Each of these areas has about 60% or more of their cropland in the Bad and Poor condition categories. This is a significant early indication of a struggling crop in these provinces that had a poor start to the growing season, especially Kumgangsan, Rason, and Ryanggang.
However, Hwanghae-namdo and Pyongyang crop conditions improved dramatically by mid-July, indicating that the delayed start over the region observed earlier was likely weather-related. As the season progressed, conditions appear to have been favorable for crops to catch up in the growing season.
Early August

By early August, crops should have neared the peak of crop health in the growing season. As a result, most of the acreages in the provinces should be Fair to Good, with a majority of areas in the Good category. However, several provinces continued to indicate struggling crop conditions. For example, the provinces and cities of Chagang-do, Kangwon-do, Kumgangsan, Rason, and Ryanggang all have NDVI readings that show about 60% or more of the cropland acreages being in the Bad to Poor categories. These NDVI conditions might indicate a negative impact on agriculture, such as a weather event or possibly less than optimal precipitation.
Only the provinces of Hwanghae-bukdo, Hwanghae-namdo, Pyongan-bukdo, Pyongan-namdo, and Pyongyang, the five primary food grain production provinces, appear to have sustained decent crop conditions, with about 40% of the crop acreages in the Good category. Even so, only Hwanghae-namdo and Sinuiju had only 30% of the crop acreages in the Poor to Bad categories. Hwanghae-namdo was likely only doing well from earlier excess moisture. The remainder of the provinces’ and cities’ crops were beginning to wane.
Mid-August


By mid-August, crops should have reached their peak and begun moving past that peak in crop condition. Most of the acreages in the provinces should still be Fair to Good, with a majority of areas split evenly between Fair and Good. The provinces of Chagang-do, Kangwon-do, Kumgangsan, Rason, and Ryanggang all have NDVI readings very similar to those of early August, characterized by minimal improvement and a substantial majority of the crops in the Poor to Bad condition categories.
Of particular concern is the dramatic reduction of crop conditions in Hwanghae-bukdo, Hwanghae-namdo, and Pyongyang. Hwanghae-bukdo crop conditions showed that 25% of the crops in the province dropped out of the Good category and, overall, nearly 20% of the crop acreages fell into the Poor to Bad categories. In Hwanghae-namdo, 29% of the crops fell out of the Good category, and the overall conditions showed that 23% of the crops dropped into the Poor and Bad categories. In Pyongyang, 17% of the cropland dropped out of the Good category, and overall, 10% of the crop acreages fell into the Poor or Bad categories. The two other primary grain-producing provinces, Pyongan-bukdo and Pyongan-namdo, saw slight reductions in crop conditions, but not with the same severity as the previous three.
Changes in Crop Conditions in Primary Agriculture Areas in the Southwest
Taking a different look at the southwest’s five primary grain production provinces, we can examine how the NDVI readings changed across the different time periods. Each of the graphs shows how the crop conditions improved by early August and then decreased by mid-August.

The crop growth in Hwanghae-bukdo started slowly, and only about 60% of the production area reached Fair conditions through the summer. The condition of the crops decreased significantly by mid-August, to approximately 40% of area in the Fair or Good categories.

Crop conditions in Hwanghae-namdo started slowly but improved to reach about 70% in Fair or better condition. However, by mid-August, conditions decreased considerably with about 50% of crops in the Fair or better category, indicating serious production concerns for the province.

Pyongan-bukdo exhibited the most normal NDVI progression over the timeframe. The NDVI conditions improved the most and sustained better crop health than the other four provinces.

The patterns observed in the Pyongan-namdo production areas were similar to those of Pyongan-bukdo, but overall conditions were slightly less favorable.

Pyongyang’s crop growth started slowly, with most production areas reaching a peak of about 60% in Fair or better condition. After that, however, only about 35% reached Good condition. By mid-August, only about 25% of the crops were in Good condition.
The mapping indicates that the crop conditions in the two most southwestern regions – Pyongyang and Hwanghae-namdo – have been impacted more than those of Pyongan-bukdo and Pyongan-namdo. With worsened agricultural conditions over the latter part of the growing season, Pyongyang and Hwanghae-namdo will likely experience lower crop yields.
Special thanks to Seongjoon Hwang for his research support.